


Velocity is the holy grail all pitchers chase in today’s game. In pursuit of it, they may not risk their lives, but they quite literally risk their limbs. With the year-over-year stats at Baseball Savant, we can actually spot the extreme outliers in gains and dips in 2025 vs. 2024.
The results question the whole scheme. They do not prove beyond a reasonable doubt that extreme changes in velocity significantly impact performance or even rise to a civil standard of preponderance of evidence.
Advertisement
I co-wrote an article eight years ago detailing why chasing velocity by maxing out on fastballs is the leading cause of elbow surgeries.
From that Wall Street Journal article: “There’s no magic number on the radar gun that puts a pitcher at risk. It varies case by case. The real issue is pitchers throwing their hardest. “If a guy tops off at 96 and pitches the whole game (there), he’s adding a lot more stress on his elbow than if he varies his velocity,” says Dr. Glenn Fleisig, research director of the American Sports Medicine Institute.”
Fleisig compares the body’s ligaments — including the one in the elbow that tears and requires pitchers to miss a season recovering from Tommy John Surgery — to a rubber band. Pull it back as hard as you can, and it will start to tear. Pull it less, he says, and “you’d never tear the rubber band.”
But if it’s worth it when it comes to success, you can at least see why it’s chased so doggedly, consequences be damned. But does it lead to success? Judge for yourself:
I looked at the dozen pitchers who lost the most velocity on their fastball, according to Baseball Savant, in 2025 vs. 2024. The range was minus-4.0 mph to minus-1.2 mph. The average ERA of the MPH losers in 2024 (when they threw harder) was 3.96. This year, throwing an average of 1.8 mph slower (but all at least 1.2 mph slower), the pitchers have averaged an ERA of 3.72. The average WHIP was faster in 2024, at 1.31 vs. 1.25 now. Most shockingly, Ks are up marginally — 21.4% when throwing harder vs. 22.6% with the velocity decline.
Top Velocity Decliners (2024 to 2025)
|
Player
|
YOY MPH ↓
|
ERA 2024
|
ERA 2025
|
WHIP 2024
|
WHIP 2025
|
K% 2024
|
K% 2025
|
|---|---|---|---|---|---|---|---|
|
-4 |
3.14 |
3.13 |
1.302 |
1.244 |
25.1 |
23.2 |
|
|
-3.2 |
3.46 |
3.15 |
1.212 |
1.25 |
20.3 |
21.7 |
|
|
-1.8 |
3.58 |
4.11 |
1.371 |
1.435 |
21.7 |
23.2 |
|
|
-1.7 |
4.87 |
3.45 |
1.51 |
1.489 |
14.4 |
11.7 |
|
|
-1.5 |
3.8 |
1.61 |
1.107 |
0.766 |
23.9 |
28 |
|
|
-1.5 |
5.28 |
4 |
1.533 |
1.194 |
18.6 |
21.9 |
|
|
-1.4 |
5.92 |
5.32 |
1.454 |
1.268 |
15.3 |
14.1 |
|
|
-1.4 |
2.03 |
5.91 |
1.035 |
1.533 |
22.7 |
18.4 |
|
|
-1.3 |
4.16 |
2.83 |
1.462 |
1.221 |
22.2 |
25 |
|
|
-1.2 |
3.57 |
6.16 |
1.199 |
1.51 |
24 |
23.6 |
|
|
-1.2 |
3.96 |
3.17 |
1.233 |
0.989 |
26.5 |
30.5 |
|
|
-1.2 |
3.72 |
1.8 |
1.297 |
1.114 |
19.5 |
30.3 |
|
|
-1.8 |
3.96 |
3.72 |
1.31 |
1.25 |
21.2 |
22.6 |
What is happening? I was ready to say even marginal gains across the board, which I wholeheartedly expected, were not worth the injury risk. But to significantly risk potentially career-ending injuries for not only measly gains, but actual losses, is madness. Fantasy managers should stop chasing velocity, even though MLB teams and pitchers insist it can be a paradigm shift in performance. My advice is not to pay for it. If I get it for free, fine. We’re not betting on long-term health in our game, even though the injury risk in a given season is also higher.
“OK,” you’re asking, “but what about the gainers?” Did they at least improve dramatically? You’ll see names including the two Hunters, Brown and Greene, along with Jesus Luzardo, and you’re forgiven if you thought your bias would be confirmed.
Top Velocity Gainers (2024 to 2025)
|
Player
|
YOY MPH ↑
|
ERA 2024
|
ERA 2025
|
WHIP 2024
|
WHIP 2025
|
K% 2024
|
K% 2025
|
|---|---|---|---|---|---|---|---|
|
1.8 |
4.75 |
6.21 |
1.335 |
1.68 |
14.7 |
16.7 |
|
|
1.6 |
2.75 |
2.36 |
1.018 |
0.81 |
27.7 |
34.7 |
|
|
1.4 |
3.49 |
1.43 |
1.271 |
0.83 |
25.1 |
32.2 |
|
|
1.2 |
3.32 |
3.1 |
1.244 |
1.176 |
20.3 |
28.5 |
|
|
1.3 |
4.74 |
5.95 |
1.381 |
1.271 |
24.2 |
27.4 |
|
|
1.3 |
3.12 |
8.04 |
1.142 |
1.7 |
20.7 |
15.8 |
|
|
1.1 |
5.1 |
4.41 |
1.245 |
1.316 |
19.8 |
19.7 |
|
|
1.1 |
5 |
1.95 |
1.245 |
1.15 |
21.2 |
27.7 |
|
|
1.1 |
4.86 |
4.29 |
1.368 |
1.643 |
23.8 |
27.3 |
|
|
1.1 |
3.06 |
5.33 |
1.06 |
1.41 |
21.6 |
22.9 |
|
|
1 |
6.52 |
4.5 |
1.63 |
1.25 |
20.4 |
18.2 |
|
|
1.3 |
4.25 |
4.32 |
1.27 |
1.29 |
21.8 |
24.6 |
Alas, even with the group of pitchers who have increased velocity, the average ERA is actually higher with the extra gas this year — 4.32 to 4.25. The WHIP is also higher — 1.29 to 1.27. Ks are up a lot with the increase in fastball juice — 24.6% vs. 21.8% for the group last year when they threw significantly slower.
Advertisement
If we use median, we get an ERA edge for the velocity gainers and a much bigger K% increase, but no change in WHIP. The median with the biggest mph losers either has no impact or increases the edges at the slower average speed. So, even with medians, the assumption that velocity matters had a 2-4 record in the six key stat categories. With averages, the record in those six stats was 1-5. And again, the extreme velocity gainers didn’t even sweep Ks, which I would have conceded.
(Top photo of Nathan Eovaldi: Alika Jenner / Getty Images)
This news was originally published on this post .
About the author

Neporažený Sivák se chystá do nového světa. Nemá co ztratit, tvrdí organizátoři
Pro Siváka by se jednalo o patřičnou změnu i vzpruhu v přípravě. Rázem by to nebylo pouze o již zajetých dovednostech. „Je to pro mě takový náboj si zkusit něco nového. Myslím si, že by mi to jedině prospělo. Jak víte, jsem prostě jiný. Ne každému prospívá zápasit K-1 i MMA, ale dej Bůh, mně to jen prospěje,“ věří si pětadvacetiletý rodák z Ostravy.„Bylo by to super, kdyby to vyšlo. Už jsme dokonce předběžně domluveni na listopadový turnaj v košické Steel Aréně. Řešíme spolu i nějaký kemp, aby se na to mohl kvalitně připravit,“ přibližuje Marhanský.Foto: RFAVáclav Sivák (vlevo) v milionovém souboji proti Patriku Záděrovi.Jediným z důvodů pro nečekanou novinku může být i fakt, že Sivák v postoji nemá na domácí scéně konkurenci. Důkazem je hned 33 vítězství a řada mistrovských titulů. „MMA je úplně jiná disciplína, nový sport, do kterého by chtěl vstoupit. Pro lidi to bude velký tahák, když uvidí, že se Vašek […]
Leclerc fastest despite clash with Stroll in eventful Monaco first practice
Home hero Charles Leclerc topped an eventful first practice for the Monaco Grand Prix despite clashing with Lance Stroll.Leclerc beat Max Verstappen by 0.163s in a session which saw several drivers getting caught out by traffic around the tight confines of Monaco, including Lewis Hamilton who went airborne to avoid the Mercedes of Kimi Antonelli at the high-speed Swimming Pool chicane. Earlier on, Leclerc ran into the back of Stroll on the approach to the famous Turn 6 hairpin as the Aston Martin driver moved onto the racing line when Leclerc was on a flying lap.The incident caused a brief red flag after 10 minutes due to debris and Ferrari fixed Leclerc's front corner quickly before the Monegasque driver delighted the home crowd by going fastest. Stroll missed the remainder of the session due to damage on his gearbox.Encouragingly for […]
Es geht um die Sperre – Real kassiert Rüdiger-Klatsche
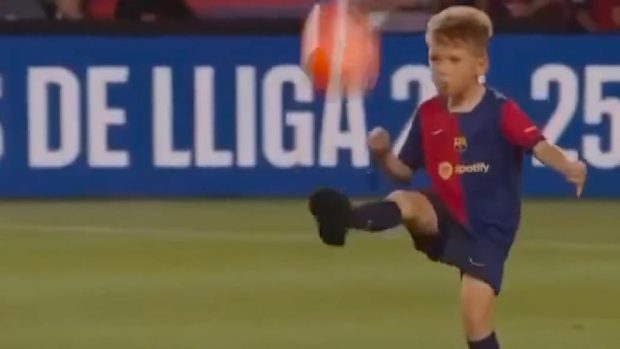
Erneuter Rückschlag für Real Madrid und Abwehr-Boss Antonio Rüdiger (32).Der deutsche Nationalspieler rastete bei der Niederlage im Pokal-Finale gegen den FC Barcelona völlig aus (2:3 n.V.), sah die Rote Karte und wurde im Anschluss für 6 Spiele gesperrt.Die Königlichen versuchten die Strafe des Verteidigers zu drücken – doch jetzt wird bekannt: Das Berufungskomitee des spanischen Verbandes „Rref“ bleibt hart, Rüdigers Sperre wird nicht verringert!Was war passiert?Nach genialem Fallrückzieher: Barça-Star verhindert Tor vom eigenen Sohn<!-->[-->Quelle: BILD21.05.2025Der deutsche Nationalspieler rastete bei der Niederlage im Pokal-Finale gegen den FC Barcelona am 26. April völlig aus (2:3 n.V.). In der Nachspielzeit hatte Schiri Burgos Bengoetxea (39) ein vermeintliches Stürmer-Foul von Kylian Mbappé (26) gepfiffen. Rüdiger warf aus Wut darüber von der Seitenlinie einen Gegenstand in Richtung des Unparteiischen. Als wäre das nicht genug gewesen, pöbelte Rüdiger eine Schimpftirade auf Deutsch hinterher.Mehrere Mitspieler und Team-Offizielle […]
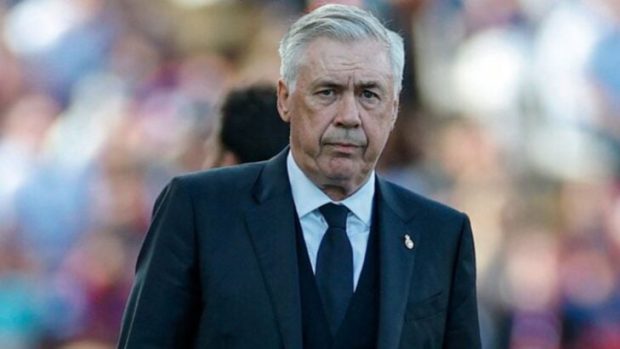
Leão sugere medida ao abordar protagonista da seleção brasileira com Ancelotti: “Não vai jogar”
Carlo Ancelotti, novo técnico da seleção brasileira (Divulgação - Real Madrid) Emerson Leão não compreende o motivo de Vinícius Júnior não empolgar pela seleção. Cotado para ser o maior protagonista em campo, o camisa 7 teve bons momentos, mas o desempenho extraordinário visto pelo Real Madrid segue pendente no Brasil. Como Ancelotti conhece o atacante de perto, houve uma sugestão de que o treinador tenha um diálogo claro nos bastidores e considere até mesmo barrar um dos protagonistas da equipe. “É difícil explicar (rendimento diferente). Eu não sei se a seleção foi altamente veloz ou ele não se adaptou ainda a uma realidade. Acho que se ele jogasse no Brasil e na seleção brasileira, ele renderia mais. A emoção de jogar perante aos torcedores seria maior e o respeito também.”, disse Leão, ao podcast Milton Neves 100 Mi Mi Mi, […]
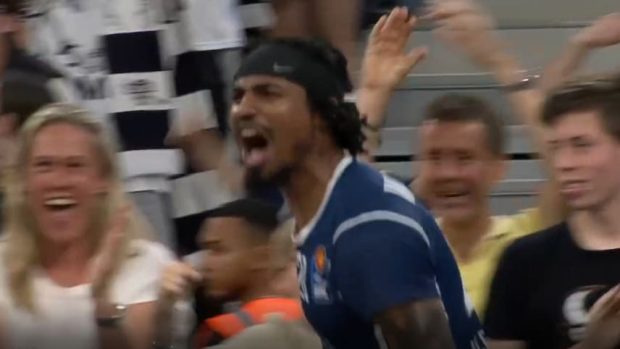
Nach Playoff-Aus – Rundumschlag von Gießen-Trainer
Er ist ein Mann der klaren Worte ...Branislav Ignjatovic (58), Trainer von Zweitligist Gießen 46ers, holte nach dem dramatischen Aus im Play-off-Halbfinale gegen Science City zum Rundumschlag aus. Der Serbe nagelte munter gegen die Schiedsrichter und die Liga.Ignjatovic: „Ich fühle mich betrogen!“Was ihn auf die Zinne brachte, war die aus seiner Sicht dürftige Leistung des Referee-Trios mit Milutin Jelenic an der Spitze. Ignjatovic: „Ich habe nicht mal gemerkt, dass Maximilian Meier der zweite Schiri war, denn der erste Schiri hat sich komplett versteckt. Alle wichtigen Entscheidungen hat sein Kollege übernommen. Mit einem Ziel, das nur er kennt ...“Foto: BILD<!-->]-->Gleich im ersten Viertel kassierte Gießens Trainer ein technisches Foul, weil er ein unsportliches Foul gegen Jena anzeigte. „Ohne etwas zu kommentieren, nur gezeigt - und er dreht sich rum und zeigt ein T“, sagt Ignjatovic. Minuten später sei die gleiche Situation […]
Related
Neporažený Sivák se chystá do nového světa. Nemá co ztratit, tvrdí organizátoři
Pro Siváka by se jednalo o patřičnou změnu i vzpruhu v přípravě. Rázem by to nebylo pouze o již zajetých dovednostech. „Je to pro mě takový náboj si zkusit něco nového. Myslím si, že by mi to jedině prospělo. Jak víte, jsem prostě jiný. Ne každému prospívá zápasit K-1 i MMA, ale dej Bůh, mně to jen prospěje,“ věří si pětadvacetiletý rodák z Ostravy.„Bylo by to super, kdyby to vyšlo. Už jsme dokonce předběžně domluveni na listopadový turnaj v košické Steel Aréně. Řešíme spolu i nějaký kemp, aby se na to mohl kvalitně připravit,“ přibližuje Marhanský.Foto: RFAVáclav Sivák (vlevo) v milionovém souboji proti Patriku Záděrovi.Jediným z důvodů pro nečekanou novinku může být i fakt, že Sivák v postoji nemá na domácí scéně konkurenci. Důkazem je hned 33 vítězství a řada mistrovských titulů. „MMA je úplně jiná disciplína, nový sport, do kterého by chtěl vstoupit. Pro lidi to bude velký tahák, když uvidí, že se Vašek […]
Leclerc fastest despite clash with Stroll in eventful Monaco first practice
Home hero Charles Leclerc topped an eventful first practice for the Monaco Grand Prix despite clashing with Lance Stroll.Leclerc beat Max Verstappen by 0.163s in a session which saw several drivers getting caught out by traffic around the tight confines of Monaco, including Lewis Hamilton who went airborne to avoid the Mercedes of Kimi Antonelli at the high-speed Swimming Pool chicane. Earlier on, Leclerc ran into the back of Stroll on the approach to the famous Turn 6 hairpin as the Aston Martin driver moved onto the racing line when Leclerc was on a flying lap.The incident caused a brief red flag after 10 minutes due to debris and Ferrari fixed Leclerc's front corner quickly before the Monegasque driver delighted the home crowd by going fastest. Stroll missed the remainder of the session due to damage on his gearbox.Encouragingly for […]
Es geht um die Sperre – Real kassiert Rüdiger-Klatsche
Erneuter Rückschlag für Real Madrid und Abwehr-Boss Antonio Rüdiger (32).Der deutsche Nationalspieler rastete bei der Niederlage im Pokal-Finale gegen den FC Barcelona völlig aus (2:3 n.V.), sah die Rote Karte und wurde im Anschluss für 6 Spiele gesperrt.Die Königlichen versuchten die Strafe des Verteidigers zu drücken – doch jetzt wird bekannt: Das Berufungskomitee des spanischen Verbandes „Rref“ bleibt hart, Rüdigers Sperre wird nicht verringert!Was war passiert?Nach genialem Fallrückzieher: Barça-Star verhindert Tor vom eigenen Sohn<!-->[-->Quelle: BILD21.05.2025Der deutsche Nationalspieler rastete bei der Niederlage im Pokal-Finale gegen den FC Barcelona am 26. April völlig aus (2:3 n.V.). In der Nachspielzeit hatte Schiri Burgos Bengoetxea (39) ein vermeintliches Stürmer-Foul von Kylian Mbappé (26) gepfiffen. Rüdiger warf aus Wut darüber von der Seitenlinie einen Gegenstand in Richtung des Unparteiischen. Als wäre das nicht genug gewesen, pöbelte Rüdiger eine Schimpftirade auf Deutsch hinterher.Mehrere Mitspieler und Team-Offizielle […]
Leão sugere medida ao abordar protagonista da seleção brasileira com Ancelotti: “Não vai jogar”
Carlo Ancelotti, novo técnico da seleção brasileira (Divulgação - Real Madrid) Emerson Leão não compreende o motivo de Vinícius Júnior não empolgar pela seleção. Cotado para ser o maior protagonista em campo, o camisa 7 teve bons momentos, mas o desempenho extraordinário visto pelo Real Madrid segue pendente no Brasil. Como Ancelotti conhece o atacante de perto, houve uma sugestão de que o treinador tenha um diálogo claro nos bastidores e considere até mesmo barrar um dos protagonistas da equipe. “É difícil explicar (rendimento diferente). Eu não sei se a seleção foi altamente veloz ou ele não se adaptou ainda a uma realidade. Acho que se ele jogasse no Brasil e na seleção brasileira, ele renderia mais. A emoção de jogar perante aos torcedores seria maior e o respeito também.”, disse Leão, ao podcast Milton Neves 100 Mi Mi Mi, […]
Nach Playoff-Aus – Rundumschlag von Gießen-Trainer
Er ist ein Mann der klaren Worte ...Branislav Ignjatovic (58), Trainer von Zweitligist Gießen 46ers, holte nach dem dramatischen Aus im Play-off-Halbfinale gegen Science City zum Rundumschlag aus. Der Serbe nagelte munter gegen die Schiedsrichter und die Liga.Ignjatovic: „Ich fühle mich betrogen!“Was ihn auf die Zinne brachte, war die aus seiner Sicht dürftige Leistung des Referee-Trios mit Milutin Jelenic an der Spitze. Ignjatovic: „Ich habe nicht mal gemerkt, dass Maximilian Meier der zweite Schiri war, denn der erste Schiri hat sich komplett versteckt. Alle wichtigen Entscheidungen hat sein Kollege übernommen. Mit einem Ziel, das nur er kennt ...“Foto: BILD<!-->]-->Gleich im ersten Viertel kassierte Gießens Trainer ein technisches Foul, weil er ein unsportliches Foul gegen Jena anzeigte. „Ohne etwas zu kommentieren, nur gezeigt - und er dreht sich rum und zeigt ein T“, sagt Ignjatovic. Minuten später sei die gleiche Situation […]
Be the first to leave a comment