


- Leonard has upside that could warrant interest: Leonard is a strong runner and excels at avoiding sacks.
- Leonard’s stable passing metrics are worrisome: The Notre Dame gunslinger finished well below the 50th percentile in most stable PFF passing metrics.
- 2025 NFL Draft season is here: Try PFF’s best-in-class Mock Draft Simulator and learn about 2025’s top prospects while trading and drafting for your favorite NFL team.
Estimated Reading Time: 4 minutes
The 2025 NFL Draft is quickly approaching, and the draft class is rounding into shape. With the PFF big board live and mock draft season in full swing, teams and analysts are gaining a clearer picture of the top prospects and the deepest position groups in this year’s class.
Projecting college football stars to the NFL is never an exact science, but using PFF grades and advanced data, we can get a clearer picture of how prospects might transition to the next level. By analyzing performance trends, key metrics and positional benchmarks, we can identify which players are best positioned to succeed — and which may face challenges — when making the jump from college to the pros.
Let’s take a look at Riley Leonard, who earned an 83.5 overall PFF grade last year with an 78.2% adjusted completion percentage. After leading the Fighting Irish to the national championship, Leonard is slotted as a likely Day 3 pick.
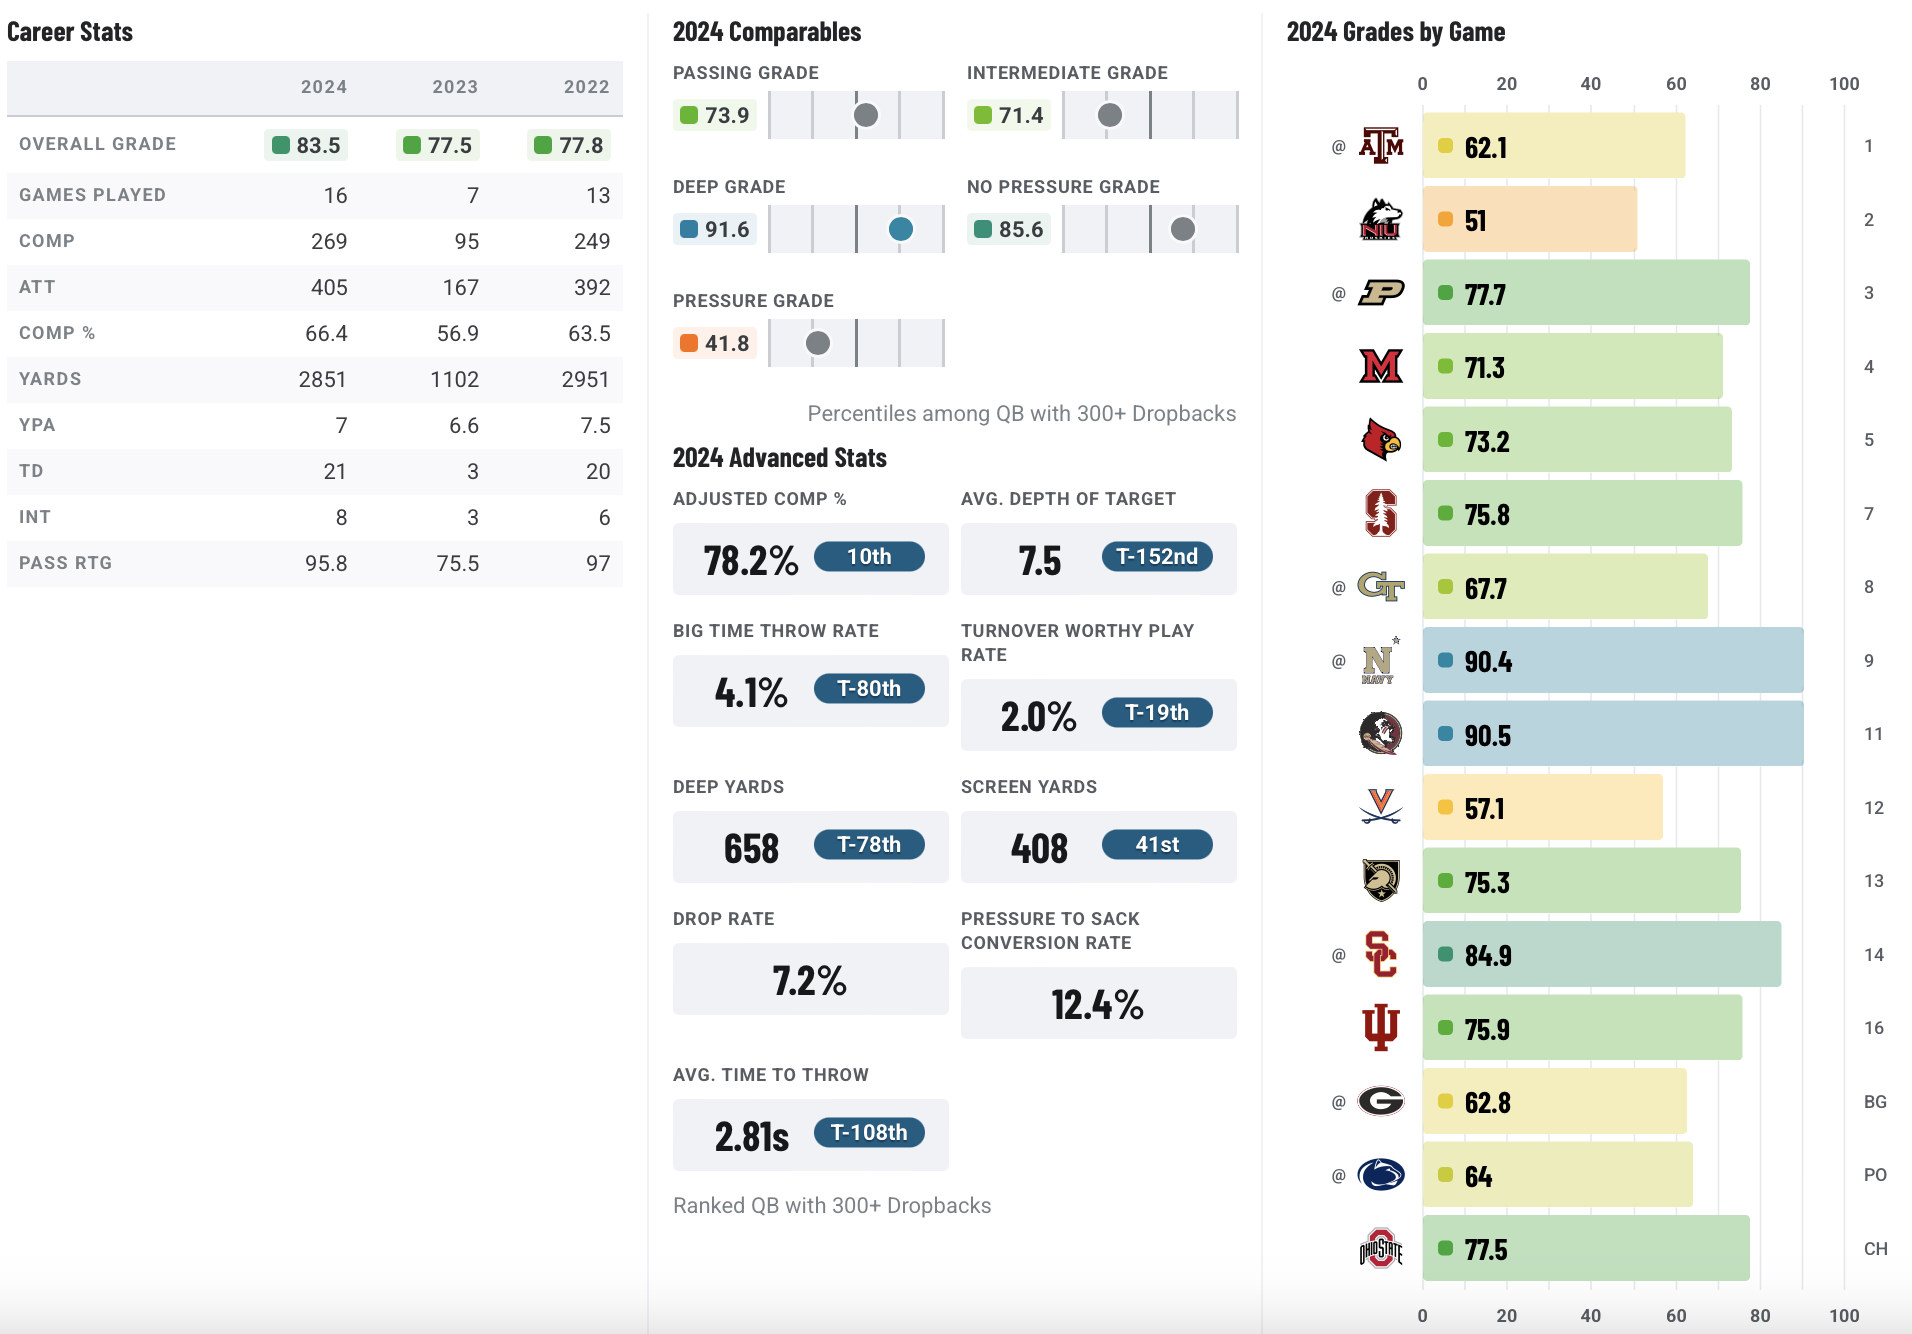
SCOUTING SUMMARY
Leonard is a former three-star quarterback from Fairhope, Ala., where he was a two-sport athlete and was initially torn between football and basketball. He received basketball offers from Samford, Missouri State and North Alabama after averaging more than 20 points per game as a senior but ultimately chose football, committing to Duke. He made one start as a true freshman before becoming the full-time starter for the next two seasons, though he missed a significant portion of the 2023 season due to an ankle injury. He transferred to Notre Dame, where, after a conservative start, he helped propel the team to a College Football Playoff berth and eventually played for a national championship.
Leonard is a well-built quarterback whose most alluring trait is his dual-threat ability. He is a battering ram-style runner who isn’t afraid to take off, absorb hits and do the dirty work to move the chains.
However, his passing remains too inconsistent. While he displays good throwing fundamentals, his accuracy and ball placement are issues. His early-down passing grade is among the lowest in this class, and his third-down passing stats highlight a lack of individual success — he threw past the sticks on third-and-7-plus just 35% of the time. Though he can escape the pocket and extend plays with his legs, his passing grade under pressure has been poor over the past two seasons.
Despite his inconsistencies, Leonard remains an intriguing quarterback due to his flashes of understanding progressions, timing, pocket toughness and willingness to make full-field reads.
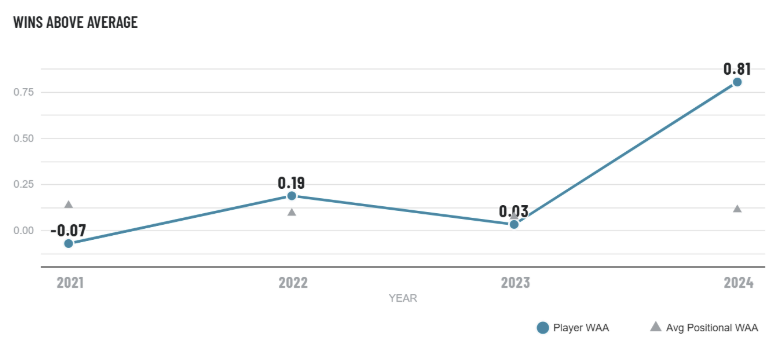
WINS ABOVE AVERAGE
WAA represents the number of wins a player is worth over an average college football player and is a metric that evaluators can utilize to assess performance. It combines how well a player performed in each facet of play (using PFF grades) and how valuable each facet is to winning football games. The result is a first-of-its-kind metric that allows for cross-positional valuation and predicts future value at the player and team levels.
HOW RILEY LEONARD RANKS IN THE STABLE METRICS (2022-24)
Stable metrics are more reliable indicators of future success than volatile, high-variance stats. The most stable facets of a player’s performance are those measured over larger sample sizes, even if they may seem less impressive or “easier” on the surface. These metrics provide consistency, making them more predictive over time. While unstable metrics may capture highlight plays, they often fluctuate from year to year. Prioritizing stability provides a clearer picture of a player’s true ability and long-term potential.
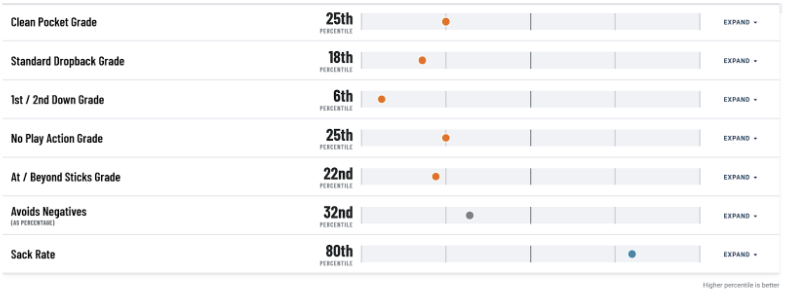
Riley Leonard’s stable metrics profile isn’t pretty, as he ranks well below the 50th percentile in every stat listed here except for one. However, sack rate is one of the stickier metrics in college-to-pro projections, and that was a major strength in Leonard’s game during his college career.
RILEY LEONARD’S PROJECTIONS
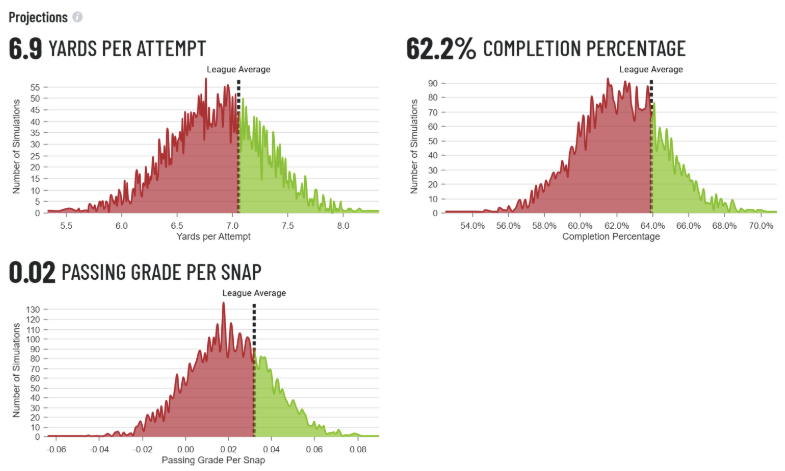
In league-average circumstances, here are Leonard’s projections for yards per attempt and completion percentage as an NFL rookie:
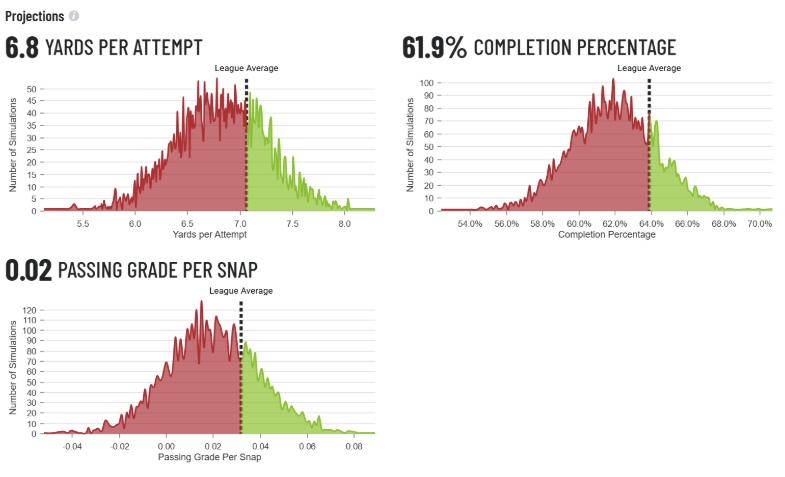
Leonard’s rookie-year projections in a league-average scheme with a play-action rate of 25%, a pressure rate of 35%, a quick-throw rate (under 2.5 seconds) of 50% and a short-throw rate (before the sticks) of 63%.
Let’s look at how Leonard does when we make his situation better. With a low pressure rate, a high play-action rate and more downfield looks, we do see Leonard’s projected yards per attempt and completion percentage increase slightly. Hopefully we get to see Leonard play in these types of conditions at some point in the NFL to help fulfill his potential.
Leonard’s 2024 projections in a situation where 25% of his dropbacks have pressure and he runs play action on 30% of his dropbacks.
Let’s also look at how Leonard does when we make the situation less favorable. With a high pressure rate and a low play-action rate, Leonard’s projections don’t change drastically from the projections we ran with the first set of conditions. Leonard’s good sack rate in college suggests that he may be able to handle pressure relatively well in the NFL.
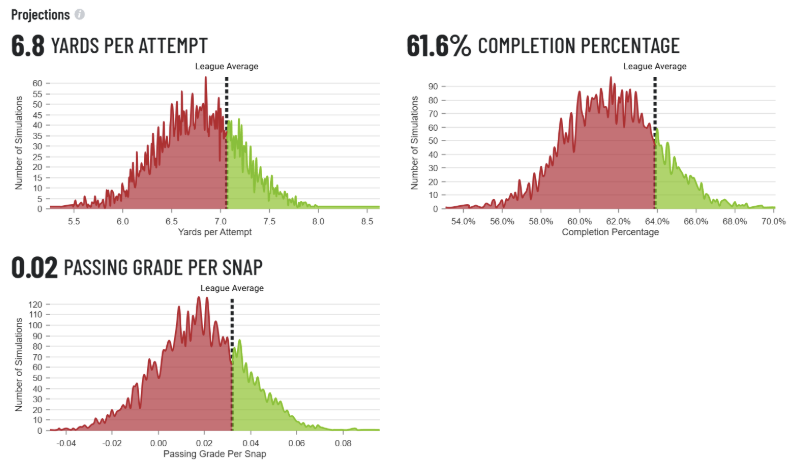
Leonard’s 2024 projections in a situation where 40% of his dropbacks have pressure and he runs play action on just 15% of his dropbacks.
BOTTOM LINE FROM PFF’s 2025 NFL DRAFT GUIDE
Leonard is a tough, dual-threat quarterback with plus value as a runner, but his passing efficiency numbers reveal too many inconsistencies on a throw-by-throw basis for him to be an NFL starter. That will have to improve if he is to be more than a backup.
This news was originally published on this post .


About the author


Slovenský tvrďák si žije svůj sen. V UFC válí, teď může raketově vystřelit
Z pohledu Kleina se skutečně jedná o jedinečnou šanci. Při jedenáctém klání (7 výher, 2 porážky a 1 remíza) za oceánem může v případě triumfu nakouknout mezi naprosto světovou elitu, neboť doposud ani jednou nefiguroval mezi patnáctkou nejlepších v lehké váze (70 kg). Souboj s polským protivníkem to konečně může změnit.Cítíte úlevu, že byl váš zápas proti Gamrotovi konečně oznámen i ze strany UFC?Mám velkou radost. My jsme o tom samozřejmě věděli, ale bylo to takové, že to ještě nebylo ze soupeřovy strany oficiálně podepsané. Tolik jsem nevěřil tomu, že Mateusz se mnou vezme zápas, protože mu to podle mého nedává až takový smysl. Nikam ho to neposune. Já jsem ale samozřejmě doufal, že se to stane, a přál jsem si, aby to přijal a podepsal. Jen jsem tomu nedával až takové šance.Jaké jste zaznamenal reakcí okolí?Čekal jsem, že mě všichni budou odepisovat a budou říkat, že zápas nedává žádný smysl a Gamrot mě jednoznačně […]

No edge rushers for Lions on NFL Draft Day 2 as Brad Holmes sticks to his plan
ALLEN PARK, Mich. — Brad Holmes and the Detroit Lions war room were spotted wearing hoodies that read “HWS” — height, weight, speed — crossed out. The Lions typically coordinate their apparel during draft weekend. They’ve worn “positional villain” hoodies. They’ve collectively worn Dan Campbell jerseys, perhaps an ode to drafting Dan Campbell guys. So when Holmes emerged Friday at the end of night two, he explained the latest draft-related message.Advertisement“Height, weight, speed — it is the opposite of film evaluation, and we’re all about film evaluation,” Holmes said. “That’s the hard part of scouting. Height, weight, speed is easy. Stats are easy. A position listed is easy. But film evaluation is hard to figure out.”The Lions believe in film. They believe it doesn’t lie. The film told them that Georgia guard Tate Ratledge and Arkansas wide reciever Isaac TeSlaa […]
With Game 3 win, Devils show resolve that could benefit them long beyond the playoffs
NEWARK, N.J. — Friday night’s double-overtime victory doesn’t mean the New Jersey Devils will win this series. It doesn’t even mean they’ll reach Game 6. They are still the heavy underdogs and trailing 2-1 against a Carolina Hurricanes team that is healthier and has more recent playoff success. Not many people would bat an eye if Carolina won the next two games and sent the Devils home for the summer.AdvertisementBut that doesn’t change the importance of New Jersey’s Game 3 win. It’s the type of game that will stick with players on the roster, from overtime hero Simon Nemec — a healthy scratch earlier this series — to Jonas Siegenthaler, who played his first game since February, to young players like Paul Cotter and Cody Glass, who took their first-ever playoff overtime shifts.It’s the type of win that builds the […]
Anthony Edwards is two wins from adding LeBron James and Luka Dončić to his collection of playoff victims
Getty Images In hindsight, it's a bit surprising how comfortably Anthony Edwards deferred to the NBA's elder statesmen at the Olympics.The brashest player in the NBA happily came off of the bench as Stephen Curry, LeBron James and Kevin Durant led Team USA to gold. Never mind that he'd just swept Durant out of the playoffs. He played only 13 minutes when Team USA overcame Nikola Jokić and Serbia in the semifinals. Maybe the game wouldn't have been so close if Edwards had seen more minutes. After all, he'd just beaten Jokić in the playoffs too.That Olympic tournament set up what essentially became the narrative of professional basketball for the next year. It was supposed to be one last ride for a legendary generation of American players, one that would set Edwards and his generational cohort up to take the […]

Erst Mähne, jetzt Glatze! – Erling Haaland mit komplett neuem Look
Nanu, was ist denn da passiert?Manchester City-Star Erling Haaland (24) überrascht seine Fans mit einem ganz neuen Look. Während seiner Verletzungspause teilt er ein Bild auf Snapchat, auf dem seine langen blonden Haare nicht zu sehen sind. Stattdessen zeigt sich der Norweger plötzlich mit einer Glatze.Lesen Sie auch<!-->[-->Der Torjäger hat seit seiner Knöchelverletzung, die er sich beim FA-Cup-Viertelfinalsieg gegen Bournemouth Ende März zugezogen hat, nicht mehr gespielt. Nun teilt Haaland Einblicke in seine Genesung.Auf dem Trainingsgelände der Skyblues gibt er seinen Anhängern Einblicke in verschiedene Fitnessstudio-Sitzungen, die Thermotherapie oder die physiotherapeutischen Behandlungen. Auch auf den Videos zu sehen sind Nathan Aké (30), Kevin de Bruyne (33) und Oscar Bobb (21). In diesen Videos zeigt er dann auch die Glatze.Aber Haaland löst das Rätsel um seine neue Frisur schnell auf ...Der 24-Jährige verrät, dass er einen Haarentfernungsfilter bei Snapchat benutzt hat […]

Hall four strokes off lead as Korda makes the cut at Chevron Championship
England's Georgia Hall is just four strokes off the lead while Nelly Korda moved inside the cut after two rounds of the Chevron Championship.Hall followed her opening 69 with a 72 to sit four strokes off the lead, but Charley Hull dropped to four-over par, one behind Scotland's Gemma Dryburgh. The cut is projected to come at two-over with nine players still to finish their second rounds after thick fog delayed the start of play. Twitter This content is provided by Twitter, which may be using cookies and other technologies. To show you this content, we need your permission to use cookies. You can use the buttons below to amend your preferences to enable Twitter cookies or to allow those cookies just once. You can change your settings at any time via the Privacy Options. Unfortunately we have been unable […]
Related
Slovenský tvrďák si žije svůj sen. V UFC válí, teď může raketově vystřelit
Z pohledu Kleina se skutečně jedná o jedinečnou šanci. Při jedenáctém klání (7 výher, 2 porážky a 1 remíza) za oceánem může v případě triumfu nakouknout mezi naprosto světovou elitu, neboť doposud ani jednou nefiguroval mezi patnáctkou nejlepších v lehké váze (70 kg). Souboj s polským protivníkem to konečně může změnit.Cítíte úlevu, že byl váš zápas proti Gamrotovi konečně oznámen i ze strany UFC?Mám velkou radost. My jsme o tom samozřejmě věděli, ale bylo to takové, že to ještě nebylo ze soupeřovy strany oficiálně podepsané. Tolik jsem nevěřil tomu, že Mateusz se mnou vezme zápas, protože mu to podle mého nedává až takový smysl. Nikam ho to neposune. Já jsem ale samozřejmě doufal, že se to stane, a přál jsem si, aby to přijal a podepsal. Jen jsem tomu nedával až takové šance.Jaké jste zaznamenal reakcí okolí?Čekal jsem, že mě všichni budou odepisovat a budou říkat, že zápas nedává žádný smysl a Gamrot mě jednoznačně […]
No edge rushers for Lions on NFL Draft Day 2 as Brad Holmes sticks to his plan
ALLEN PARK, Mich. — Brad Holmes and the Detroit Lions war room were spotted wearing hoodies that read “HWS” — height, weight, speed — crossed out. The Lions typically coordinate their apparel during draft weekend. They’ve worn “positional villain” hoodies. They’ve collectively worn Dan Campbell jerseys, perhaps an ode to drafting Dan Campbell guys. So when Holmes emerged Friday at the end of night two, he explained the latest draft-related message.Advertisement“Height, weight, speed — it is the opposite of film evaluation, and we’re all about film evaluation,” Holmes said. “That’s the hard part of scouting. Height, weight, speed is easy. Stats are easy. A position listed is easy. But film evaluation is hard to figure out.”The Lions believe in film. They believe it doesn’t lie. The film told them that Georgia guard Tate Ratledge and Arkansas wide reciever Isaac TeSlaa […]
With Game 3 win, Devils show resolve that could benefit them long beyond the playoffs
NEWARK, N.J. — Friday night’s double-overtime victory doesn’t mean the New Jersey Devils will win this series. It doesn’t even mean they’ll reach Game 6. They are still the heavy underdogs and trailing 2-1 against a Carolina Hurricanes team that is healthier and has more recent playoff success. Not many people would bat an eye if Carolina won the next two games and sent the Devils home for the summer.AdvertisementBut that doesn’t change the importance of New Jersey’s Game 3 win. It’s the type of game that will stick with players on the roster, from overtime hero Simon Nemec — a healthy scratch earlier this series — to Jonas Siegenthaler, who played his first game since February, to young players like Paul Cotter and Cody Glass, who took their first-ever playoff overtime shifts.It’s the type of win that builds the […]
Anthony Edwards is two wins from adding LeBron James and Luka Dončić to his collection of playoff victims
Getty Images In hindsight, it's a bit surprising how comfortably Anthony Edwards deferred to the NBA's elder statesmen at the Olympics.The brashest player in the NBA happily came off of the bench as Stephen Curry, LeBron James and Kevin Durant led Team USA to gold. Never mind that he'd just swept Durant out of the playoffs. He played only 13 minutes when Team USA overcame Nikola Jokić and Serbia in the semifinals. Maybe the game wouldn't have been so close if Edwards had seen more minutes. After all, he'd just beaten Jokić in the playoffs too.That Olympic tournament set up what essentially became the narrative of professional basketball for the next year. It was supposed to be one last ride for a legendary generation of American players, one that would set Edwards and his generational cohort up to take the […]
Erst Mähne, jetzt Glatze! – Erling Haaland mit komplett neuem Look
Nanu, was ist denn da passiert?Manchester City-Star Erling Haaland (24) überrascht seine Fans mit einem ganz neuen Look. Während seiner Verletzungspause teilt er ein Bild auf Snapchat, auf dem seine langen blonden Haare nicht zu sehen sind. Stattdessen zeigt sich der Norweger plötzlich mit einer Glatze.Lesen Sie auch<!-->[-->Der Torjäger hat seit seiner Knöchelverletzung, die er sich beim FA-Cup-Viertelfinalsieg gegen Bournemouth Ende März zugezogen hat, nicht mehr gespielt. Nun teilt Haaland Einblicke in seine Genesung.Auf dem Trainingsgelände der Skyblues gibt er seinen Anhängern Einblicke in verschiedene Fitnessstudio-Sitzungen, die Thermotherapie oder die physiotherapeutischen Behandlungen. Auch auf den Videos zu sehen sind Nathan Aké (30), Kevin de Bruyne (33) und Oscar Bobb (21). In diesen Videos zeigt er dann auch die Glatze.Aber Haaland löst das Rätsel um seine neue Frisur schnell auf ...Der 24-Jährige verrät, dass er einen Haarentfernungsfilter bei Snapchat benutzt hat […]
Hall four strokes off lead as Korda makes the cut at Chevron Championship
England's Georgia Hall is just four strokes off the lead while Nelly Korda moved inside the cut after two rounds of the Chevron Championship.Hall followed her opening 69 with a 72 to sit four strokes off the lead, but Charley Hull dropped to four-over par, one behind Scotland's Gemma Dryburgh. The cut is projected to come at two-over with nine players still to finish their second rounds after thick fog delayed the start of play. Twitter This content is provided by Twitter, which may be using cookies and other technologies. To show you this content, we need your permission to use cookies. You can use the buttons below to amend your preferences to enable Twitter cookies or to allow those cookies just once. You can change your settings at any time via the Privacy Options. Unfortunately we have been unable […]
Be the first to leave a comment